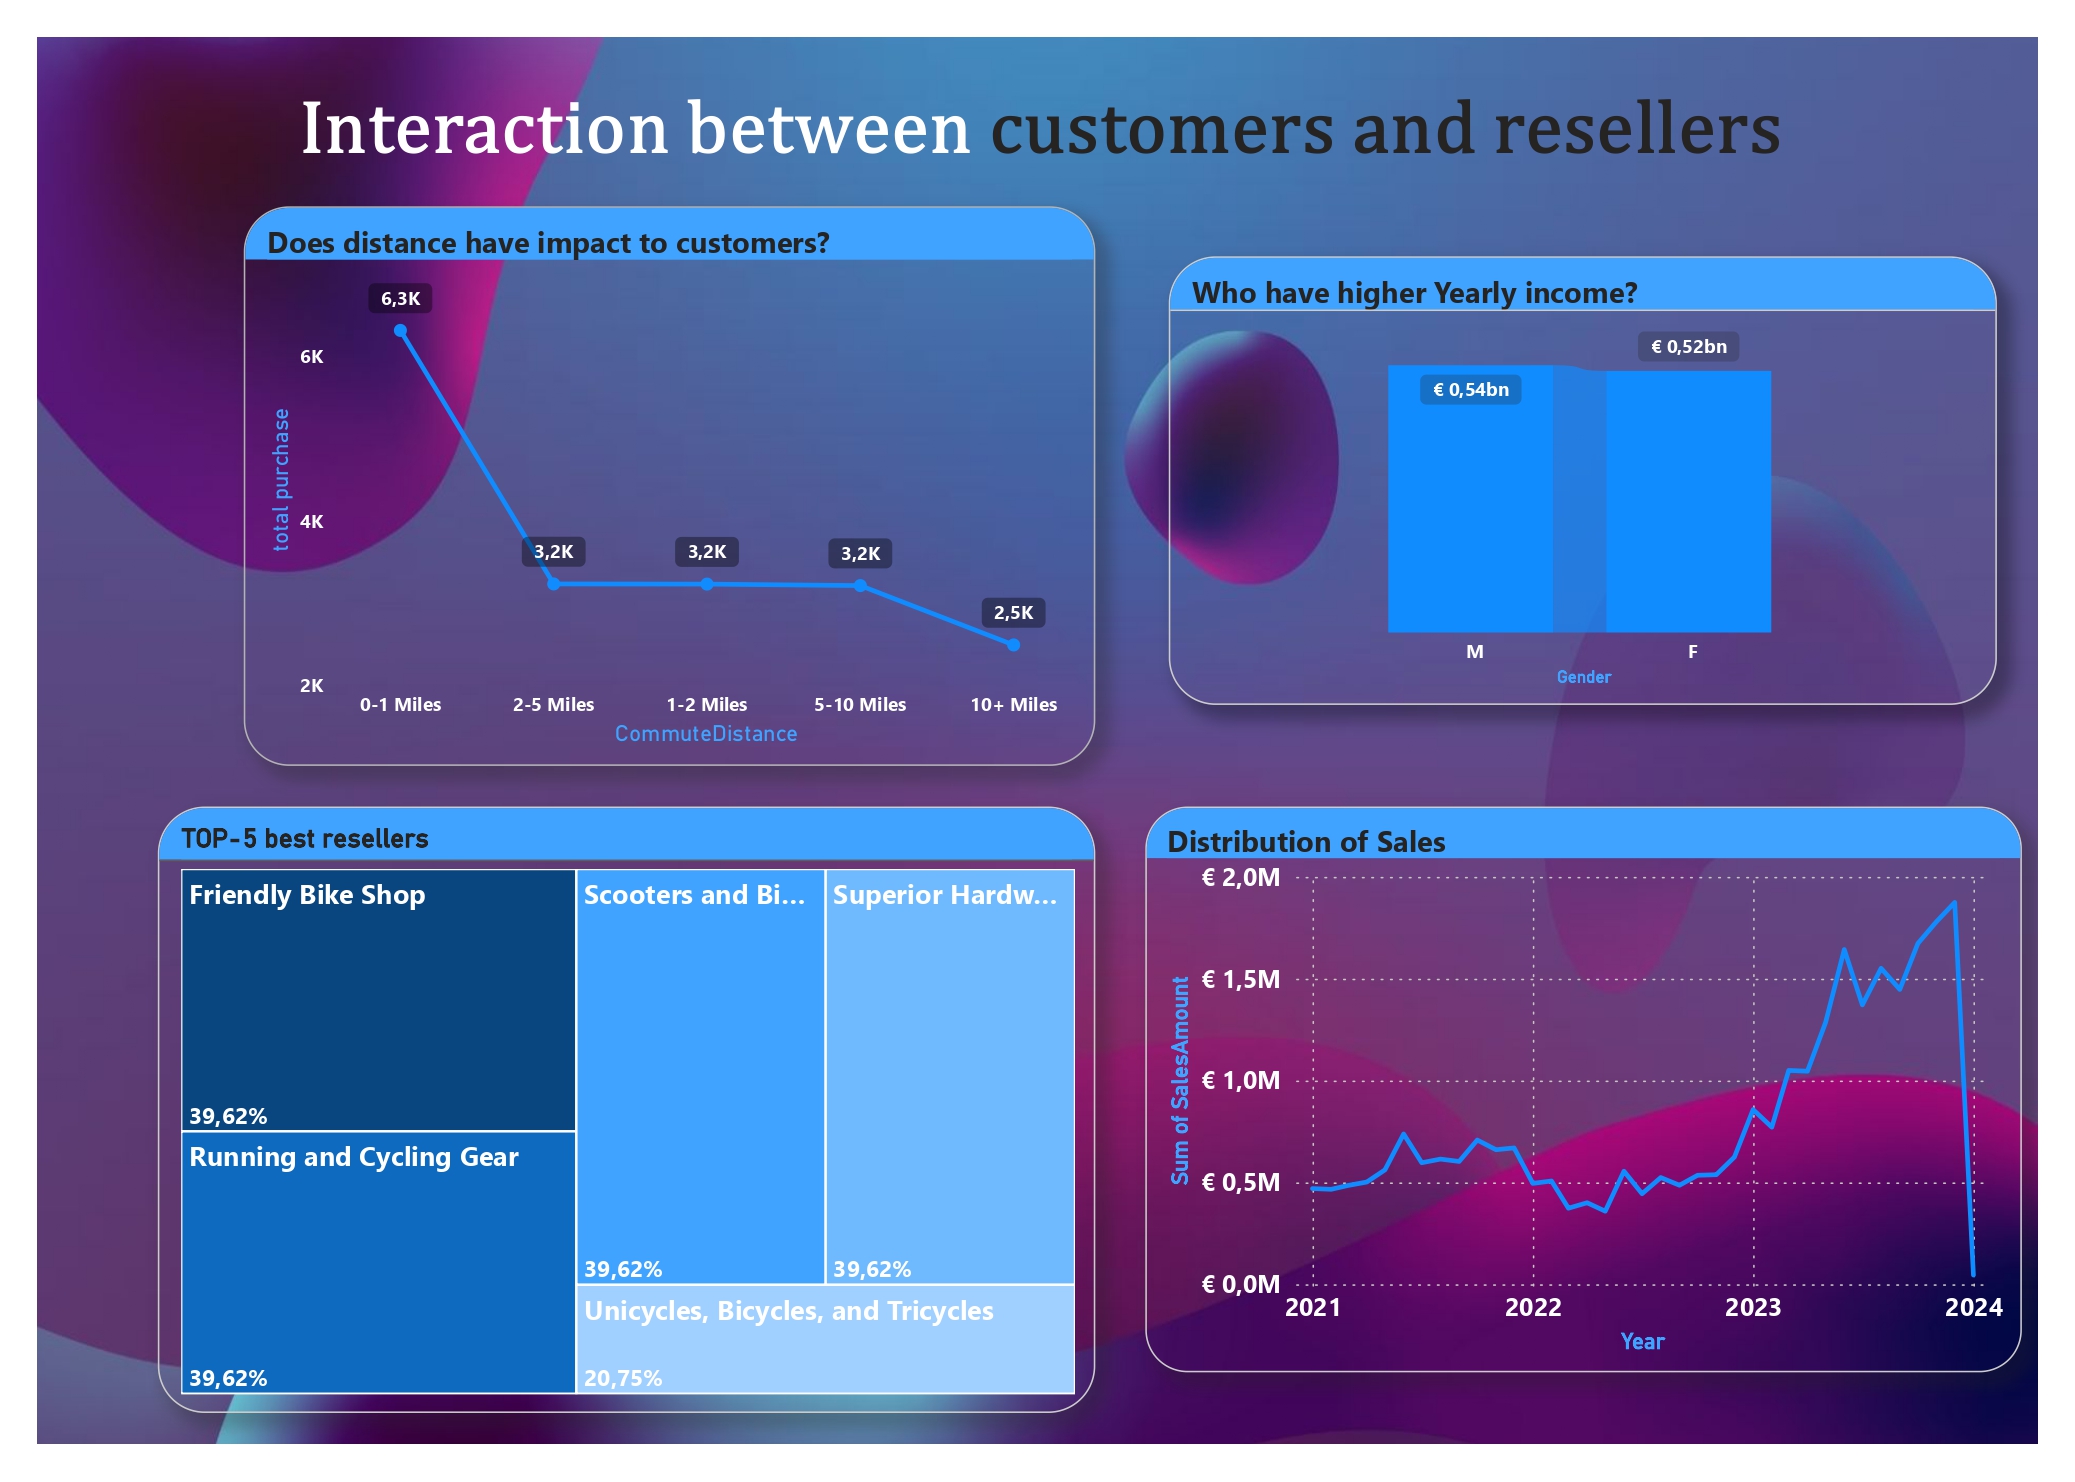


Resellers and purchases dashboard
- SQL Server Management Studio(SSMS), Power BI
- 2025
Purpose: Preparing the table for processing in Power BI involves data cleaning, aligning data types, calculating cummilative sum, movingAverage and join, using subqueries.
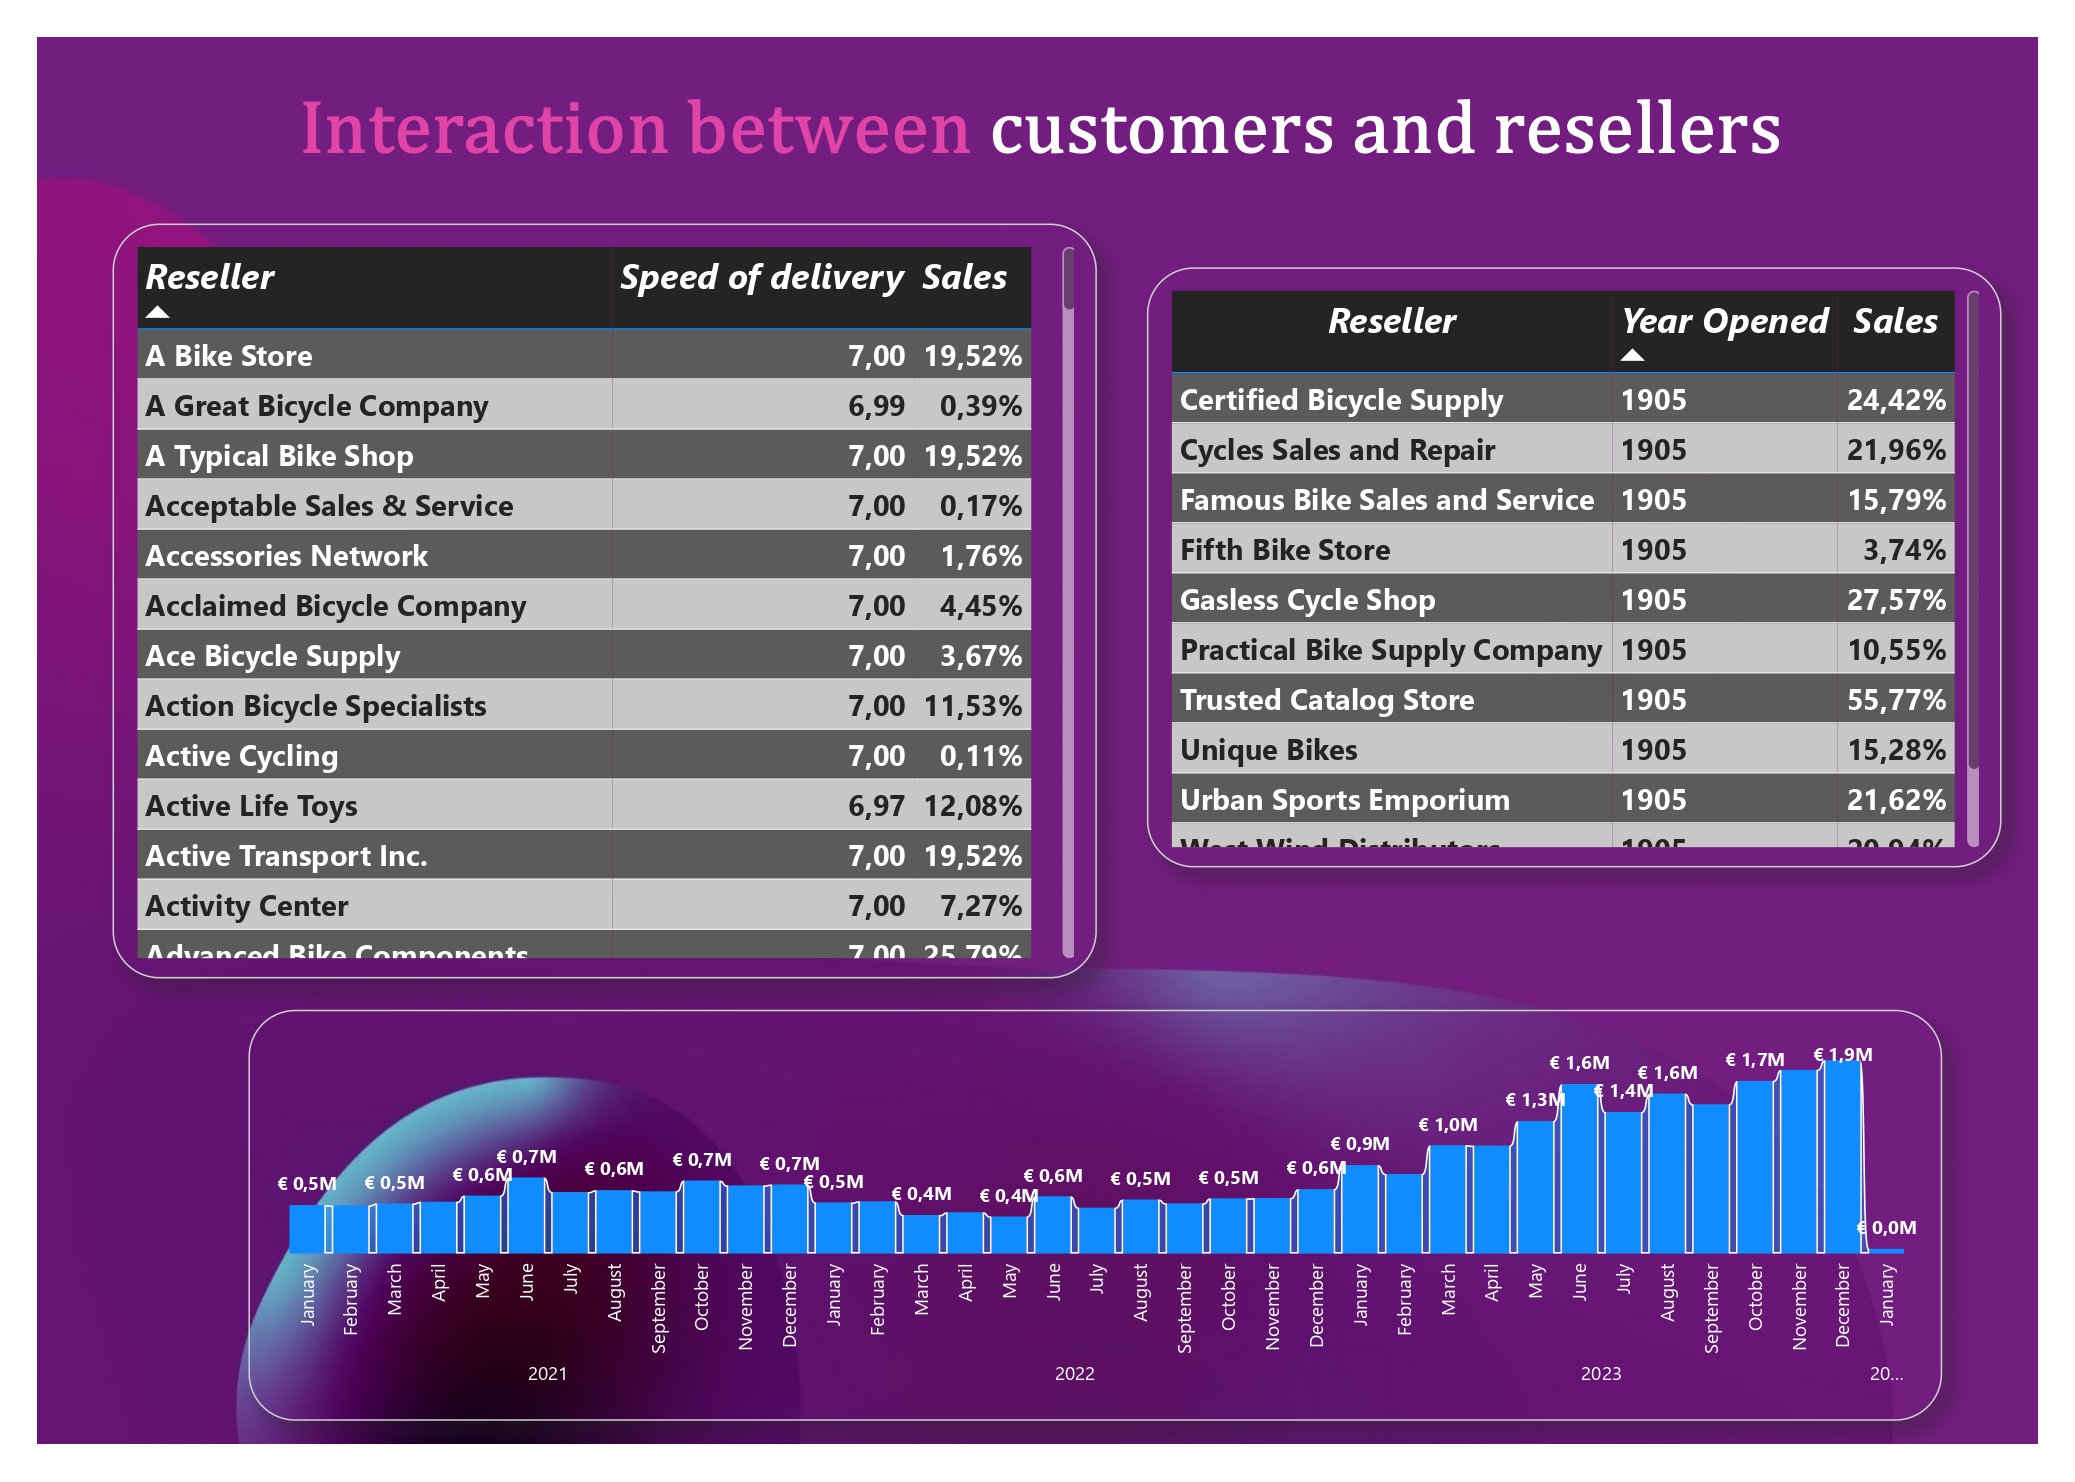
Data Structure:The Resseller and Customer tables in SSMS contains data about purchases, surname, name of customer, id of reseller, type of reseller’s business, amount of minimal purchase, etc.
Operations with data in SQL:
Changes data type to correct type and check the changes:
    --change type to data
ALTER TABLE [dbo].[FactInternetSales]
ALTER COLUMN OrderDate DATE;
--check data type
SELECT DATA_TYPE
FROM INFORMATION_SCHEMA.COLUMNS
WHERE TABLE_NAME = 'FactInternetSales' AND COLUMN_NAME = 'OrderDate';
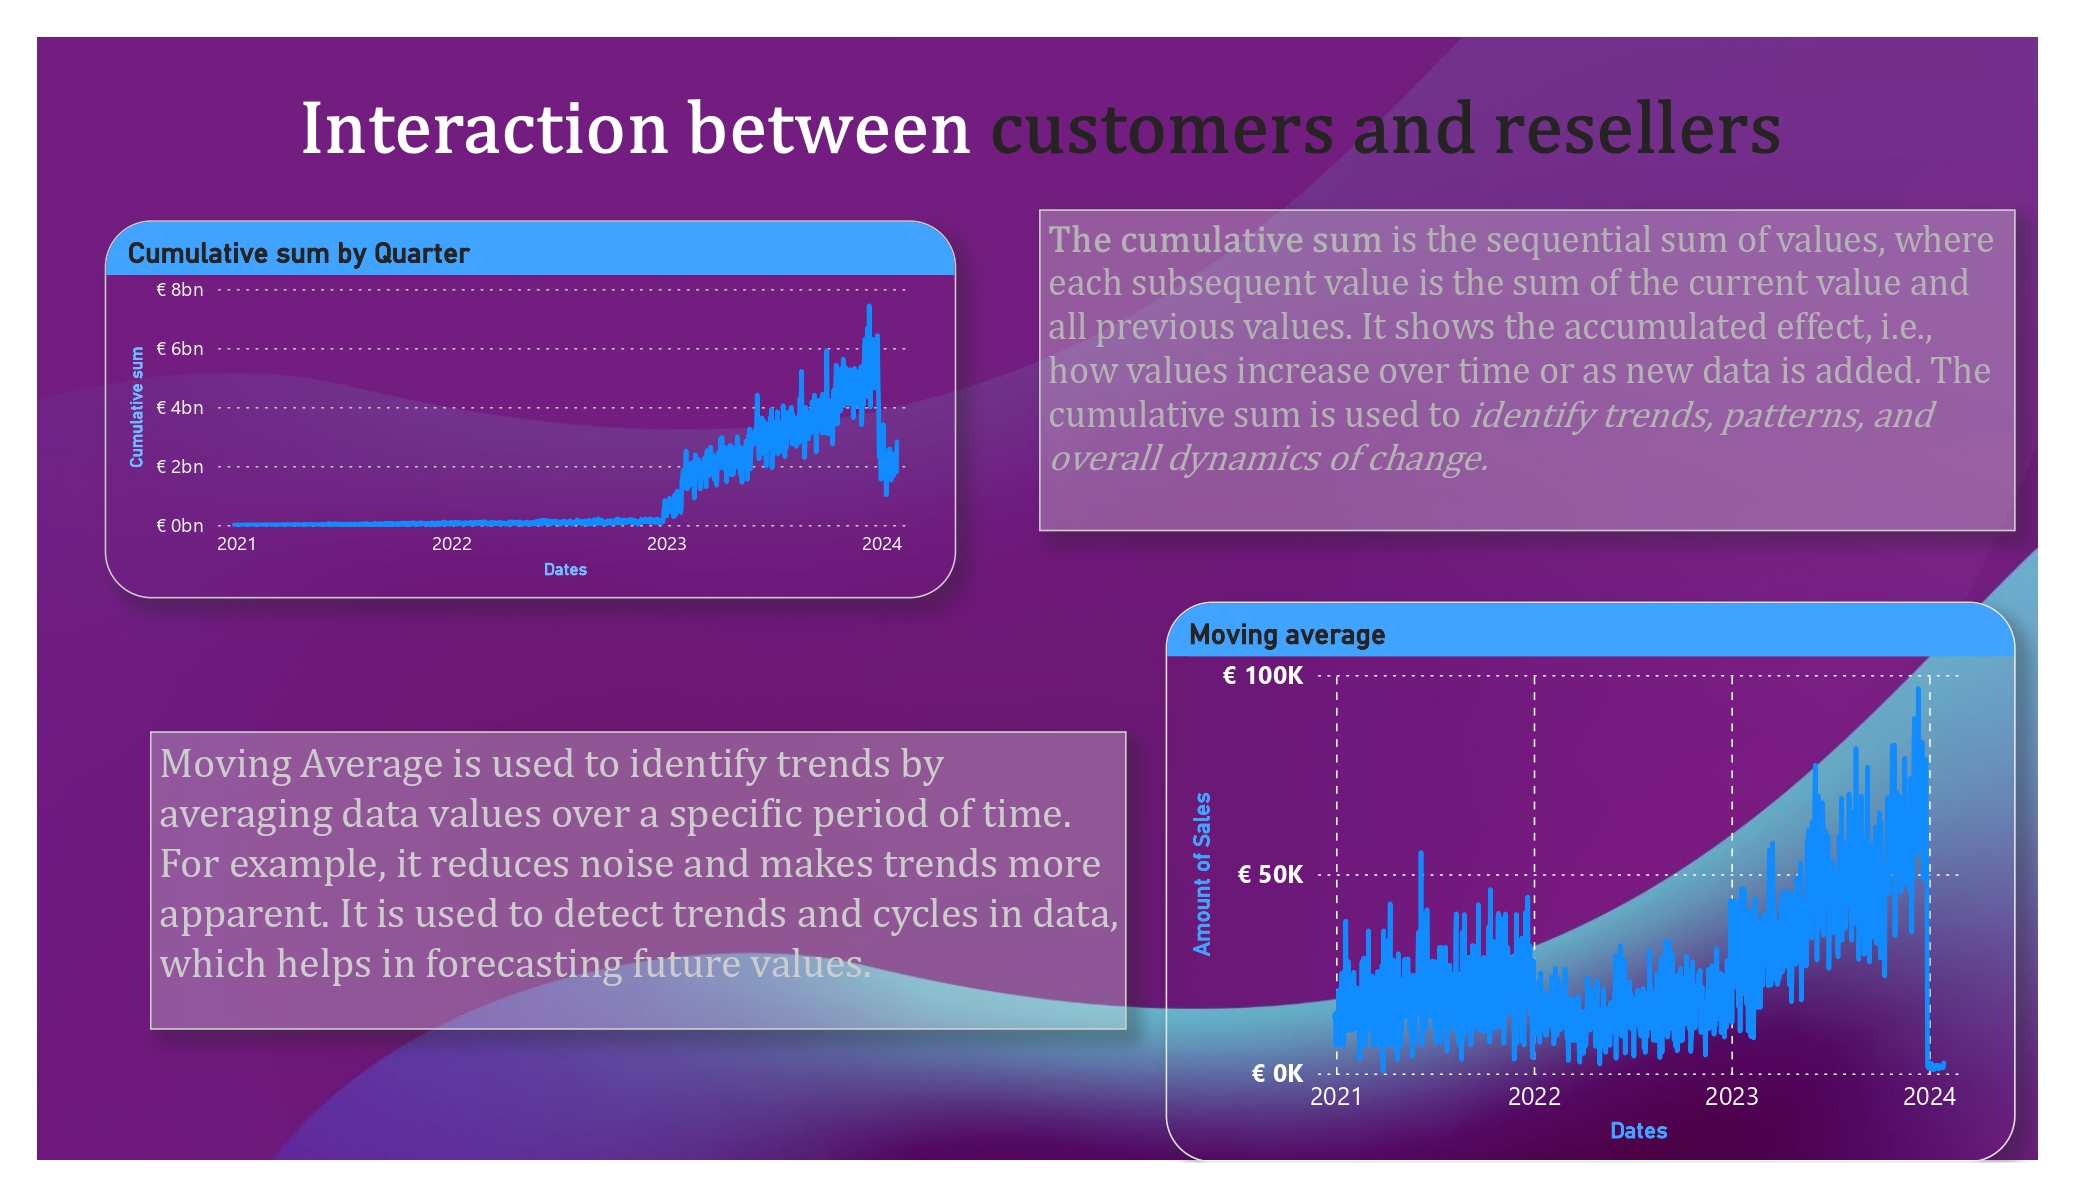
2.Calculate cummilative sum for SalesAmount. Thus, we can analyse how the total sales amount accumulates over time, which can be useful for monitoring trends, seasonality, or assessing overall sales effectiveness.
--calculate cummilative sum
SELECT
    Sales.OrderDate AS dates,
    Sales.SalesAmount AS Amount,
    SUM(Sales.SalesAmount) OVER (ORDER BY Sales.OrderDate) AS [cumulative sum]
FROM
   [AdventureWorksDW2022].[dbo].[FactInternetSales] AS Sales;
Related articles
3. Calculate moving average for Sales Amount to analyse moving average for each row. This can be useful for smoothing out fluctuations in the sales data and identifying trends over time.
    ---MovingAverage calc
	SELECT
    OrderDate,
    SalesAmount,
    AVG(SalesAmount) OVER (ORDER BY OrderDate ROWS BETWEEN 2 PRECEDING AND CURRENT ROW) AS MovingAverage
FROM
    FactInternetSales;
4. Next part is joint data in two tables - Customer and Reseller. For this reason I use the following query
SELECT
    Customer.TotalChildren AS ChildrenImpact,
    Customer.FirstName,
    Customer.LastName,
    R.ResellerName,
    R.BusinessType,
    R.MinPaymentAmount
FROM
    DimReseller AS R
RIGHT JOIN
    DimCustomer AS Customer ON Customer.GeographyKey = R.GeographyKey
    WHERE
    R.AnnualRevenue > (
        SELECT AVG(revenue) AS avg_revenue
        FROM (
            SELECT AVG(DimReseller.AnnualRevenue) AS revenue
            FROM DimReseller
            GROUP BY DimReseller.FirstOrderYear
        ) AS avg_table
    )
order by R.MinPaymentAmount DESC;


