IE < 9

Please update your browser for better experience

update now

Loading

Product dashboard

  • GA,Data Studio tools
  • 2025

This was a solo analytics project where I acted as a Web Analyst and UX Researcher for a pet food and pet care brand. The goal of the project was to demonstrate how product, marketing, and behavioral analytics can be combined into a single, decision-oriented report.

    My responsibilities included:
  • Collecting and analyzing user-level data from analytics dashboards (traffic, engagement, and events)
  • Segmenting users based on behavior, traffic source, and interaction patterns
  • Analyzing user behavior and on-site habits within each segment
  • Mapping user journeys and key conversion flows across the site
  • Identifying and analyzing key events that users perform during their interaction with the product

The company has collected data about their users but hasn't had a clear understanding of how users navigated through the site. At the beginning, I only had a user persona created 4 years ago. My task was to clarify this persona and show how users actually interacted with the site: what their typical journey looks like, what content they prefer, and where the bottlenecks and bounce points occur.

For security and confidentiality reasons, I cannot disclose the company name or real data. All data used in this case study was modified and reflects trends only — the provided figures are not real.

⚠️ Important:

All figures presented in this report are taken from open sources and demo datasets and are not real commercial indicators of the brand.

The report is created exclusively for demonstration purposes, to show:

  • the structure of an analytical report;
  • the set of key metrics;
  • the logic of data interpretation;
  • the level of depth and quality of a web analyst’s dashboard.

Related articles

HR dashboard in Power BI and SQL
Dashboard for GA 4
Resellers and purchases dashboard

The report is designed to answer specific business questions, not just to display metrics.
Below are examples of typical requests from a product owner, marketing, and the product team.

Scenario 1.
“The owner wants to understand: is the product actually interesting to users?”
Where to look in the report (page 1):
Engagement Rate — 84.73%
Average session duration — 00:43:08
Views per session — 12.05
Event count per user — 68.09
Bounce rate — 15.3%
How to interpret:
High engagement + long sessions = users are not random
Low bounce rate = the product meets user expectations
A high number of events = active interaction with the interface
Product insight:
The core value proposition of the product is clear to users, and there is interest.
If a problem exists, it is not at the first-touch level.

Scenario 2.
“The owner asks: where does the most valuable traffic come from?”
Where to look (page 1):
Traffic sources:
Direct — 69.98%
Google — 14.22% (+2.1%)
How to interpret:
Growth in Google → organic traffic starts to play a more significant role
High Direct traffic may indicate:
a returning audience
brand demand
or untagged channels (Not set)
Product insight:
Clarify attribution
Strengthen content and SEO as a more “long-term” growth channel
Do not scale paid traffic without understanding the real source of Direct traffic

Scenario 3.
“Marketing wants to understand: does advertising actually work?”
Where to look (page 2):
CTR — 15.27%
Average CPC — $2.40
CPA — $30.72
Quality of ads — 7/10
How to interpret:
CTR above average → creatives and offers are relevant
CPC within acceptable limits → the auction is under control
CPA can be optimized through UX, not only through advertising
Product insight:
The growth limitation lies not only in advertising, but in conversion scenarios and product entry points.

This report:
connects behavior → money → decisions
shows where the problem is: in the product, UX, or marketing
helps answer the question “what should we do next?”, not “what happened?”

1. Context and goal of the report
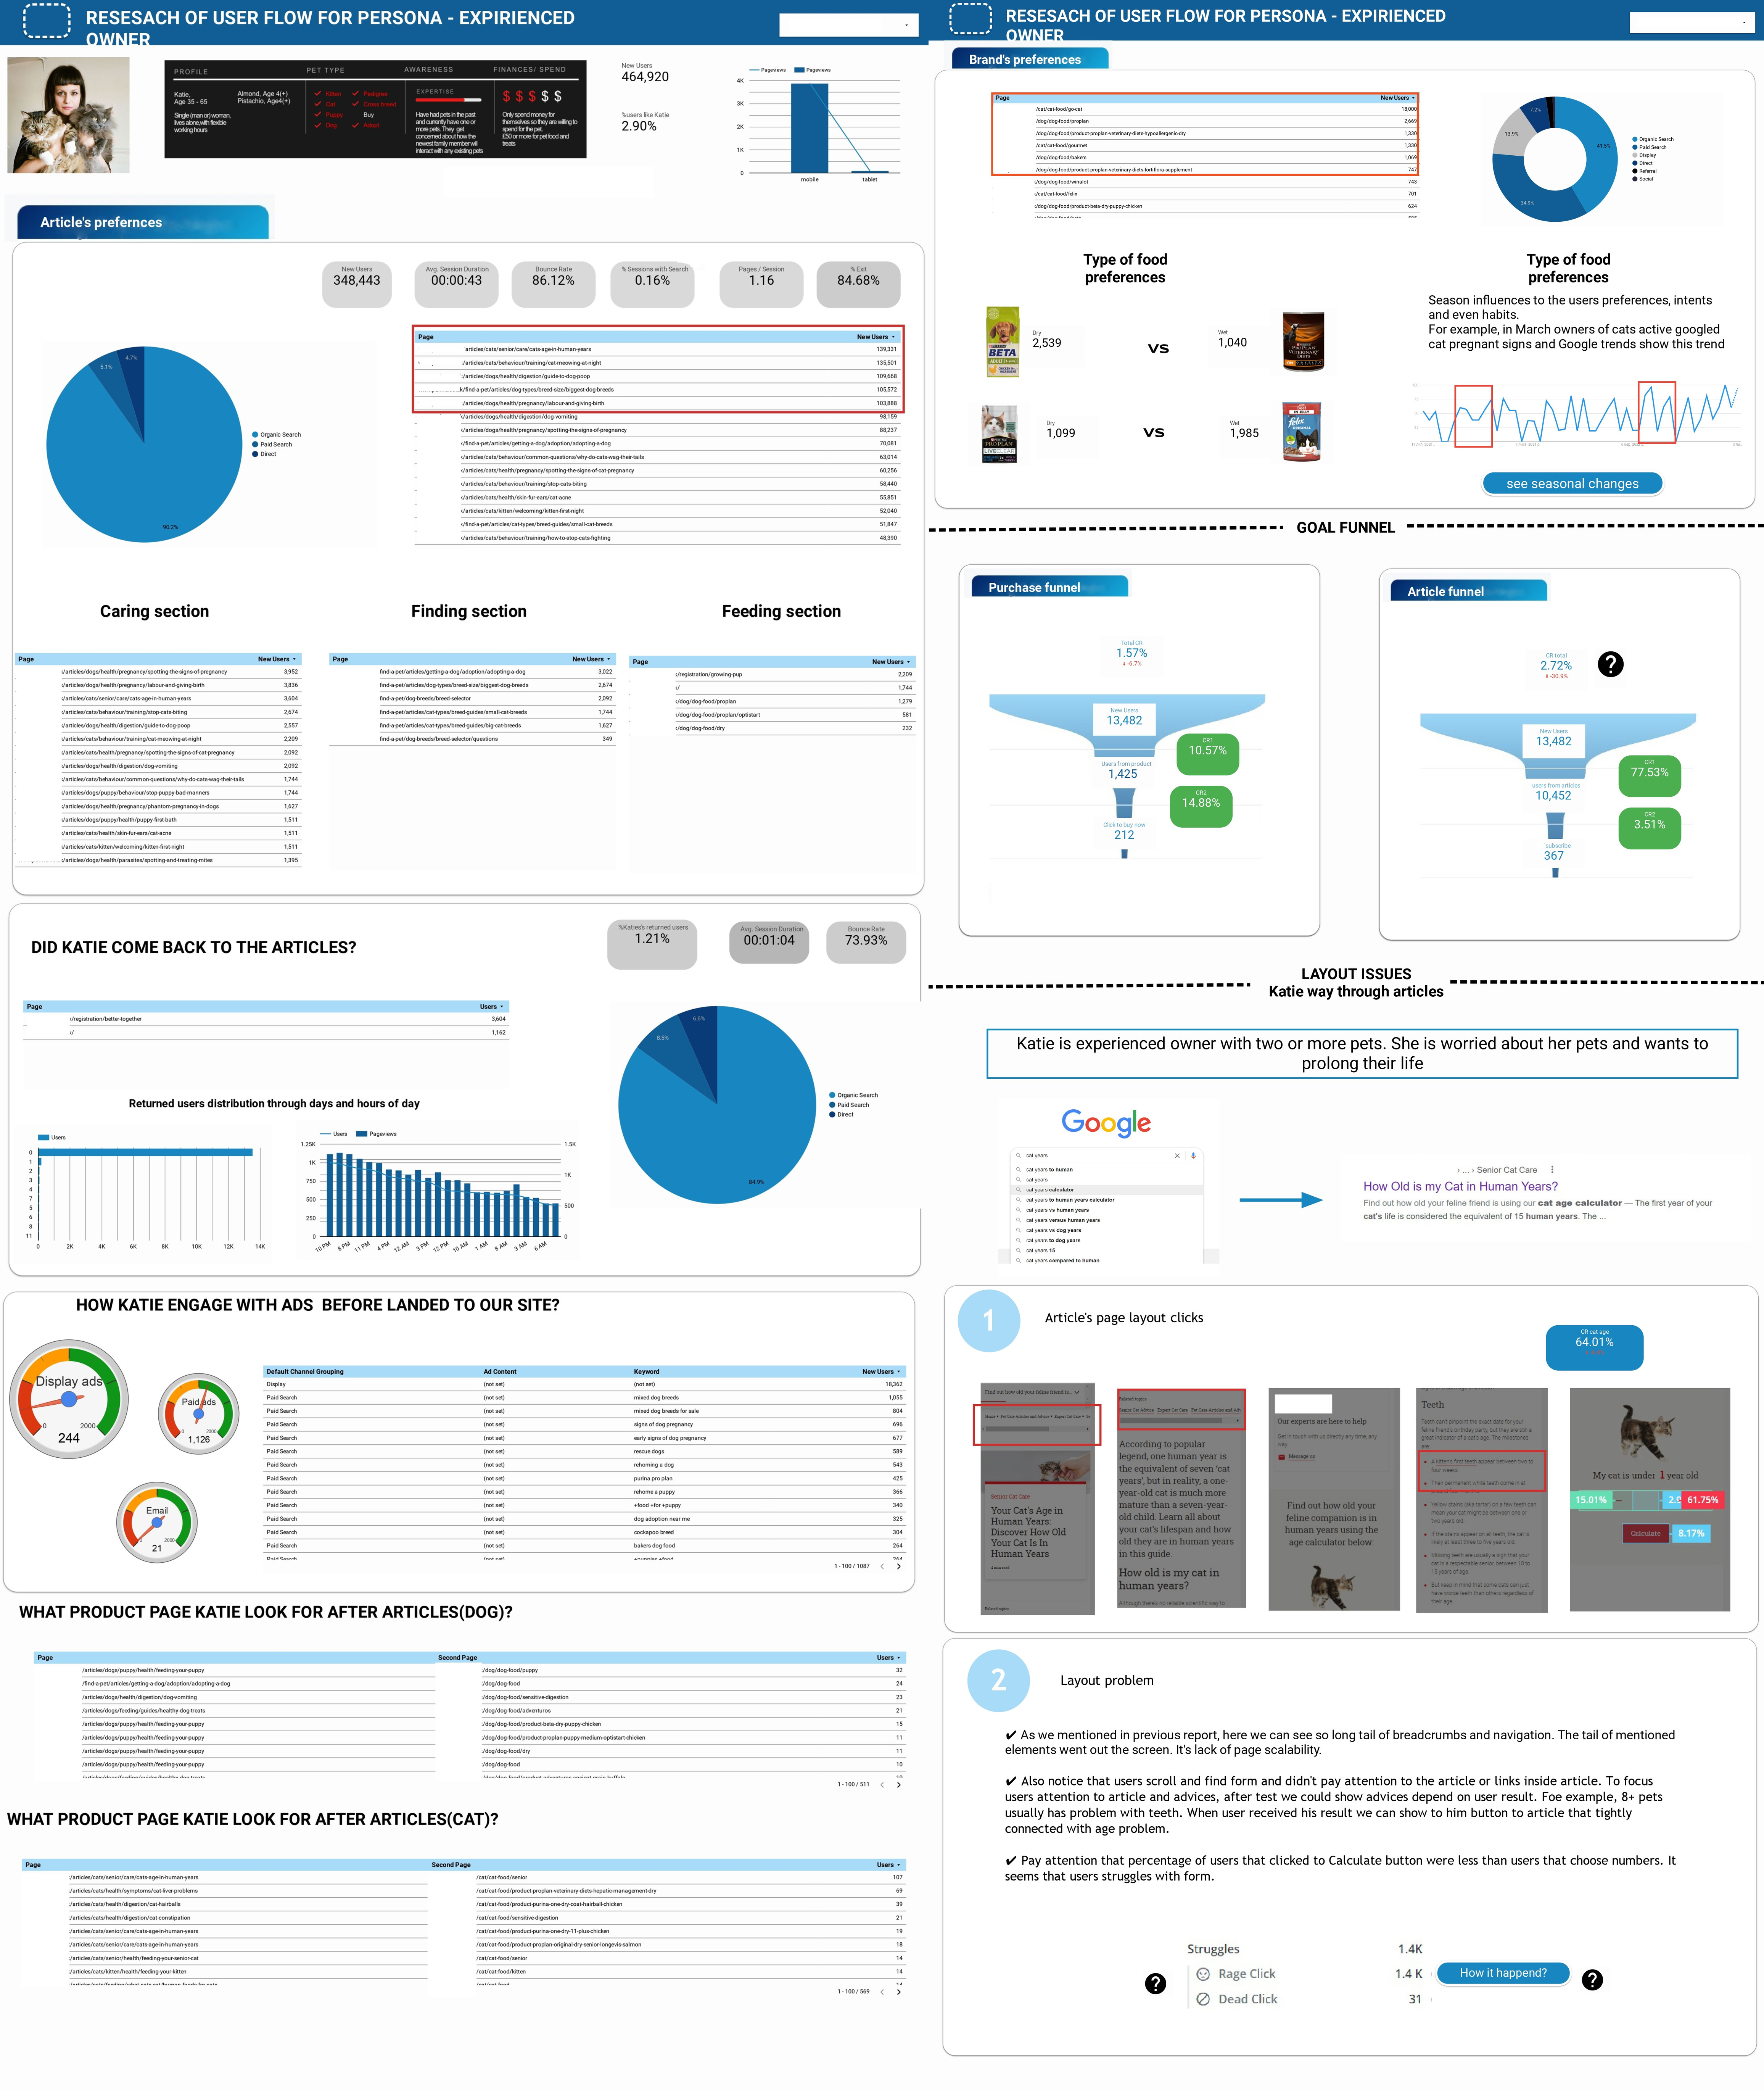
The goal of the report is to show what a full-fledged analytics dashboard for an FMCG brand promoting products through digital channels (organic + paid) can look like.
The report combines:
behavioral analytics (engagement, sessions);
marketing metrics (CTR, CPC, ROI);
conversion metrics;
advertising performance.

2. Who this report is useful for
This format of an analytics report will be especially useful for:

🔹 FMCG and eCommerce brands
brands with large traffic volumes and low average order value;
companies that need to understand not only sales, but also user behavior;
teams working with both paid and organic channels.

🔹 Marketing Directors and Heads of Marketing
to control the effectiveness of advertising channels;
to evaluate the real return on budget, not just clicks and impressions;
to make decisions about scaling or reallocating budget.

🔹 Performance and Growth teams
to identify bottlenecks in the funnel;
to analyze CR, CPA, and ROAS dynamics;
to generate hypotheses for improving creatives and landing pages.

🔹 Product and UX teams
to see how users actually interact with the product;
to evaluate engagement, depth of interaction, and activity;
as a foundation for UX and CRO experiments.

Overall traffic and engagement overview (page 1)
Key metrics:
Traffic: 42,942 users
Engagement Rate: 84.73%
Average session duration: 00:43:08
Views per session: 12.05
Event count per user: 68.09
% Active users: 87.31%

👉 This indicates high audience engagement and active interaction with the content.

Traffic sources:
Direct — 69.98%
Not set — 19.09%
Google — 14.22%

Growth in Google traffic (+2.1%) and a decrease in Direct (−2.8%) may indicate an increasing role of organic search.

Advertising performance and marketing metrics (page 2)
Key advertising metrics:
CTR: 15.27%
Average CPC: $2.40
ROI: 60%
Cost per action (CPA): $30.72
Cost per lead (CPL): $494.40
Quality of ads: 7/10

📌 CTR above the FMCG market average indicates high-quality creatives and relevant targeting.

Revenue and user value (page 2)
Total revenue: $5.05
Total ad revenue: $0.1
ARPPU: $1.15
Views: 1.1M
Bounce rate: 15.3%

A low bounce rate confirms that users are not just visiting, but actively interacting with the product.

Conversion evolution (CR evolution)
The CR graph shows a stable conversion level of ~6.6–6.7%, without sharp drops, which is important for an FMCG model with high traffic volume.

Acquisition and scaling economics (page 3)
Unit economics metrics:
AOV (Average Order Value): 117.28
CAC (Customer Acquisition Cost): 45.93
CPC: 12.81
ROAS: 350.50%
ROI: 264.58%

📈 These metrics demonstrate the potential to scale advertising campaigns, provided that current traffic quality is maintained.

7. How key metrics are calculated (pages 2–3)
Below is a mandatory block for a web analyst’s portfolio 👇

CTR (Click-Through Rate)
CTR = (Clicks / Impressions) × 100%

CPC (Cost per Click)
CPC = Advertising spend / Number of clicks

CPA (Cost per Action)
CPA = Advertising spend / Number of target actions

CPL (Cost per Lead)
CPL = Advertising spend / Number of leads

ARPPU (Average Revenue Per Paying User)
ARPPU = Total revenue / Number of paying users

AOV (Average Order Value)
AOV = Total revenue / Number of orders

CAC (Customer Acquisition Cost)
CAC = Total marketing spend / Number of new customers

ROAS (Return on Ad Spend)
ROAS = Revenue from ads / Advertising spend × 100%

ROI (Return on Investment)
ROI = (Revenue − Costs) / Costs × 100%

Conclusions:

This demonstration report shows:
how to structure analytics for an FMCG brand;
how to combine behavioral and marketing data;
how to interpret metrics not in isolation, but as a system.

FULL REPORT HERE

Quick track to connect

Telegram Icon Telegram LinkedIn Icon Linkedin Email Icon E-mail

next project

One section study
arrow